a picture of the uk scientific workforce diversity data analysis for the royal society executive summary executive summary =======
A picture of the UK scientific workforce
Diversity data analysis for the Royal Society
Executive summary
Executive Summary
=================
Background
----------
The Royal Society is concerned with excellent science wherever and by
whomever it is done. A lack of diversity across the scientific
community represents a potential loss of talent to the UK. This report
is part of a four-year programme of work to understand any barriers to
entry and progression in science, with a view to removing them.
This report describes the diversity of the UK’s scientific workforce
based on three separate commissioned analyses of different datasets.
The first uses the Annual Population Survey 2011 to provide a snapshot
of the current scientific workforce compared with the overall
workforce. The second looks at the career progression of a cohort of
mid-career individuals, using the longitudinal British Cohort Study of
over 16,000 people who were born in 1970. The third focuses on the
university sector, examining the destinations of people leaving higher
education, based on data from the Higher Education Statistics Agency
over a period of 5-6 years.
The datasets were collected for other purposes, and the extent to
which it is possible to interrogate them to describe the diversity of
the scientific workforce is necessarily limited. There are large gaps
in the data, the questions and definitions in the cohort study have
changed over time, and most significantly, there is no shared
definition of the scientific workforce. Insofar as it is possible, the
analyses presented here concentrate on individuals for whom their
scientific knowledge, training, and skills are necessary for the work
that they do.
The results present information about the gender, disability,
ethnicity and socio-economic background of people in the scientific
workforce. Other diversity characteristics tend not to be recorded in
the datasets. The three commissioned studies are published separately.
Findings
--------
The picture that emerges from the data is very complex but even with
the highly imperfect nature of the available data, distinct patterns
emerge.
Overall scientific workforce
----------------------------
*
Approximately 20 per cent of the people in the UK workforce need
scientific knowledge and training to do their current jobs.
*
Approximately one half of these people work in the private sector,
one quarter in different parts of the education system and one
quarter in other parts of the public sector.
*
Of the cohort of mid-career individuals, 47 per cent have at one
time or another worked in science.
*
As a whole, the scientific workforce is better paid than people in
other occupations, but relatively few people who work in science
are in the very highest wage band.
Gender
------
*
Women are not underrepresented in the overall scientific
workforce, but they are highly underrepresented at the most senior
roles.
*
Women are also underrepresented in certain subjects in academia;
for example, the proportion of first degree students who are
female varies from over 79% in subjects in Psychology and
Behaviour Sciences and Veterinary Science to 9.6% in Mechanical
Aero and Production Engineering subjects.
*
For a cohort of mid-career individuals, those women who entered
the scientific workforce took longer to do so after finishing
education than men did. They were also less likely than men to
remain in science throughout their careers.
*
For the same cohort, women working in science were less likely to
take career breaks than women who work in other occupations. When
women working in science do take career breaks, the break is more
often connected to the birth of a child than other reasons and are
often shorter.
*
Women are less likely than men to progress from a first degree to
further research-based study.
*
For mathematics, computer sciences, engineering and technology,
men are more likely to be employed in science occupations after
graduating from university than are women. In subjects allied to
medicine the pattern is reversed and in other disciplines, men and
women are equally likely to go into employment in the scientific
workforce.
Disability
----------
*
Disabled people are underrepresented in the workforce as a whole,
but they are no more underrepresented in the scientific workforce
than in other occupations.
*
They are less likely to be in the most senior roles than people
who are not disabled, but this trend is less pronounced in science
than in other sectors.
Ethnicity
---------
*
The pattern of ethnicity in the scientific workforce is extremely
complex.
*
Overall in the scientific workforce, black and minority ethnic
workers are relatively concentrated at the two ends of the
spectrum – they are overrepresented in the most senior and most
junior parts of the scientific workforce. However, black and black
British people are slightly underrepresented in the most senior
roles. Other ethnic groups, most notably Chinese, are
overrepresented in the most senior roles.
*
For the mid-career cohort, people from white ethnic backgrounds
were 1.5 times as likely to have worked in science at some stage
of their careers so far than those from black or minority ethnic
communities.
*
For the same cohort, an individual’s ethnic group is also related
to sector of employment – for example, people from white ethnic
backgrounds who work in science are more likely to work in
manufacturing or academia than those from black and minority
ethnic backgrounds.
*
Black and minority ethnic students are less likely to progress to
scientific jobs after graduating than white students.
Socio-economic background
-------------------------
*
Socio-economic background has a strong effect on an individual’s
likelihood of entering the scientific workforce. For the
mid-career cohort, science workers living in households in the
highest income bracket (£20,800 or over1) at age 16 in 1986 are
more than five times as likely to progress to a professional level
occupation than those in the lowest household income bracket (less
than £5,199 pa2).
*
For the same cohort, people with better educated parents and
people from middle-income families were most likely to enter
science.
*
Individuals from lower socio-economic backgrounds who did enter
the scientific workforce took longer to do so than those from
higher socio-economic backgrounds.
Recommendations
---------------
The Society believes that in order to better understand the diversity
makeup of the scientific workforce and entry, progression and
retention within the workforce future analysis of datasets could be
improved through:
1.
An agreed definition of the scientific workforce used across and
by government departments and dataset owners would allow data to
be compared and help improve understanding
of entry into and progress through the STEMM workforce for
underrepresented groups.
2.
Consistency between the definitions of and variables within
diversity characteristics which would allow better data collection
and analysis of multiple datasets on the STEMM workforce.
3.
Improved links between existing datasets to better understand the
diversity of the scientific workforce and community, from school
through to vocational, further and higher education and into the
workplace, across the full range of STEMM sectors.
4.
Better data for the private sector to build a full picture of the
scientific workforce in relation to diversity and entry into and
progression within the scientific workforce.
5.
Further exploration of graduate outcomes by ethnicity, disability,
gender and parental occupation (a measure for socio-economic
background).
A picture of the UK Scientific Workforce
----------------------------------------
As part of the Royal Society’s diversity programme the Society set out
to analyse and understand the composition of the scientific workforce
in terms of gender, disability, ethnicity and socio-economic status
and background. We commissioned several data gathering exercises to
explore these issues.
Copies of the summary report, accompanying research reports and data
tables can be downloaded from our diversity web pages.
The research reports include:
*
TBR and the Science Council (2012) ‘Leading the way: increasing
the diversity of the UK Science workforce’
*
TBR, (2013) ‘Leading the way; increasing the diversity of the
science workforce. Project two: exploring the impact of
socio-economic background on careers in science’
*
Point Research Limited (2013) ‘The diversity of the UK science
workforce: Quantitative analysis of the Annual Population Survey’
*
Oxford Research & Policy (2013) ‘Summaries of observations on the
destinations of STEMM leavers from higher education and on higher
education staff including their previous employment and leaving
destinations’
The Royal Society
-----------------
The Royal Society is a self-governing Fellowship of many of the
world’s most distinguished scientists drawn from all areas of science,
engineering, and medicine. The Society’s fundamental purpose,
reflected in its founding Charters of the 1660s, is to recognise,
promote, and support excellence in science and to encourage the
development and use of science for the benefit of humanity.
The Society’s strategic priorities are:
*
Promoting science and its benefits
*
Recognising excellence in science
*
Supporting outstanding science
*
Providing scientific advice for policy
*
Fostering international and global cooperation
*
Education and public engagement
Founded in 1660, the Royal Society
is the independent scientific academy
of the UK, dedicated to promoting
excellence in science
Registered Charity No 207043
Issued: February 2014 DES3214
For further information
The Royal Society
6 – 9 Carlton House Terrace
London SW1Y 5AG
T +44 20 7451 2500
E [email protected]
W royalsociety.org
Cover image: one of the first examples of genetic fingerprinting
developed by Alec Jeffreys FRS, 1984.
1 Adjusted for inflation, this was approximately £51,667 or over per
annum in 2012.
2 Adjusted for inflation, this was approximately less than £12,915 per
annum in 2012.
1
 LA CUBIERTA FORMA PARTE DEL CONJUNTO DE ELEMENTOS ESTRUCTURALES
 LEMBAR HASIL PENILAIAN SEJAWAT ATAU PEER REVIEW KARYA ILMIAH
 WWWALZORG PUBLIC POLICY OFFICE 202 393 7737 P 1319
 CONCILIO DE ASESORAMIENTO PARA EL DISTRITO ACTAS DE LA
 RESOURCE PACK ON SUPERVISING POSTGRADUATE STUDENTS ROISIN DONNELLY AND
 NIZOMIY NOMIDAGI TOSHKEHT DAVLAT PEDAGOGIKA UNIVERSITETI TARIX FAKUL`TETI “HUQUQ
 HARMONOGRAM ODBIORU ODPADÓW W GMINIE KULESZE KOŚCIELNE W 2017R
 UNEPCBDWGABS12 CBD CONVENIO SOBRE LA DIVERSIDAD BIOLÓGICA DISTR
 TURISTIČKI REČNIK AKTIVAN ODMOR AKTIVNOST U SLOBODNOM VREMENU
 EL SERVICIO NAVARRO DE SALUD REDUCE LAS LISTAS DE
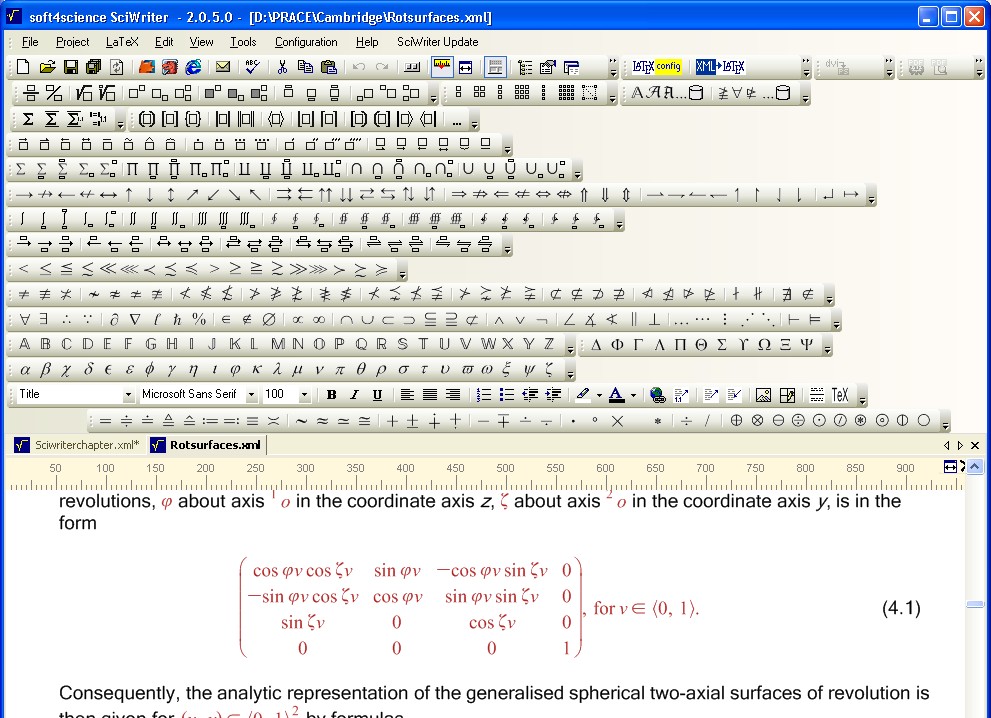 EL EDITOR SCIWRITER SCIWRITER ES UN EDITOR CIENTÍFICO BASADO