political science 30, political inquiry, homework project #3 ============================================================ due date: wednesd
Political Science 30, Political Inquiry, Homework Project #3
============================================================
Due Date: Wednesday, May 18th. Beginning of Class
Part A. Tests of Significance
=============================
#1. A survey organization recently conducted a random sample of 1000
individuals from the population of American adults. The survey
assessed the relationship between religiosity and partisanship. It
asked the individuals whether religion is an important part of your
life,” and asked them if they think of themselves as Democrats,
Republicans, or Independents. The results were as follows:
====================================================================
Partisanship
============
Religion Not Important
======================
Religion Important
==================
Total
=====
Democrat
========
130
===
220
===
350
===
Independent
===========
85
==
255
===
340
===
Republican
==========
35
==
275
===
310
===
Total
=====
250
===
750
===
1000
====
a. Construct a 99.7% confidence interval for the proportion of
American adults who claim that religion is important to them. Show
your work and tell us what your results suggest about the overall
population of all American adults.
==================================================================
b. Use a difference in proportions test to assess whether one can be
95% confident that the proportion of religious Americans who are
Democrats differs from the proportion of religious Americans who are
Independents. [By religious Americans, I mean those who responded that
religion was important to them] Show your work, specify what the null
hypothesis is, and say whether or not you can reject the null
hypothesis with 95% confidence.
======================================================================
c. Perform a chi-square test to assess whether the relationship
between religiosity and partisanship is statistically significant.
Show your work. Specify what the null hypothesis is, what the
chi-square statistic is, and whether or not you can reject the null
hypothesis with 95% confidence.
===================================================================
Part B. Initial Test for Your Data Project
#2. You are going to begin to explore the relationships between one of
the independent variables in your hypothesis and your dependent
variable, but we’ll wait until the final homework to ask you to
conduct tests of statistical significance.
a.
Restate the hypothesis that you proposed in the first homework.
Then state the null hypothesis.
b.
Using only one of your independent variables, use SPSS to produce
a graph of the bivariate relationship between this independent
variable and your dependent variable. If the independent variable
is an interval or ratio variable, you can produce a scatterplot
(Click on the “Graphs” pulldown menu, then select “Scatter,” and
then “Define.” Pull one independent variable into the x-axis box,
and then pull your dependent variable into the y-axis box). If the
independent variable is a nominal or ordinal variable, you can
produce a bar chart that reports proportions or mean or median
values of the dependent variable for cases that take on different
levels of the independent variable (just like with ethnicity and
turnout in class). Print out the graph, and describe the
relationship that you see. Do they appear to be correlated? Is the
correlation negative or positive?
c.
Think of a possible confounding variable or an intervening
variable that is included in the dataset that you are using (i.e.
make sure it appears in the list of variables for that dataset in
the SPSS manual). Later, you will explore whether it really is a
confound or an intervening variable, but for now just make an
argument that it might fit the definition of one of these sorts of
variables, going through all three criteria for a confound or
explaining why it is an intervening variable.
Below are the new SPSS hints:
If you have a nominal or ordinal independent variable:
While you are viewing the dataset, go up to the “Graphs” pull down
menu, then select “Legacy Dialogs,” then select “Bar,” and double
click on “Simple.” When the dialog box opens up, pick your independent
variable from the list of variables on the left, and place it into the
“Category Axis” box. Then go to “Bars Represent,” and click the button
for “Other Statistic (e.g., mean), and put in your dependent variable.
Click “OK” at the bottom, and you will have a bar graph where each bar
is the mean value that your dependent variable takes on for a given
value of the independent variable.
If you have an interval or ratio independent variable:
While you are viewing the dataset, go up to the “Graphs” pull down
menu, then select “Legacy Dialogs,” then select “Scatter/Dot,” click
on “Simple Scatter,” then select “Define.” When the dialog box opens
up, pick your independent variable from the list of variables on the
left, and place it into the “X Axis” box, and put your dependent
variable into the “Y Axis” box. Then click “OK.”
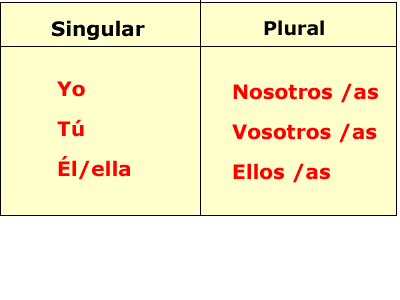
 UNIDAD III ACCIDENTES GRAMATICALES 1 EL SUSTANTIVO TRADICIONALMENTE SE
 LIVING IN THE COMMUNITY ASSESSMENT IMPORTANT PERSONAL AND HEALTH
 UNEPFAORCCOP57 UNITED NATIONS RC UNEPFAORCCOP67ADD2 ROTTERDAM CONVENTION
 CRACK THE SAFE 3 2 1 4 5 6
 ALBERTA FOREST PRODUCTS ASSOCIATION 900 10707 100TH AVENUE EDMONTON
 I I I CONCURSO DE CARTELES DÍA INTERNACIONAL DE
 PRIME DE RETRAITE MERCI PATRON ! LORS DE
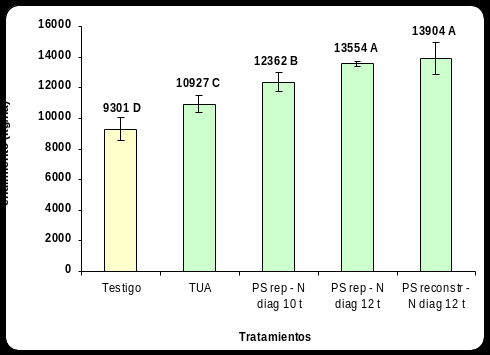
 EFECTOS DE DIFERENTES ESTRATEGIAS DE FERTILIZACIÓN SOBRE LOS RENDIMIENTOS
 AEAT DIT SG DE APLICACIONES INFORMATIVAS 2014 SERVICIOS DE
 BİLGİSAYAR VE SAĞLIK BILGISAYARIN SAĞLIĞA ZARARLARINDAN KORUNMA DOĞRU OTURUŞ
 ONTARIO MEDICAL CLINIC 196200 ONTARIO AVE MILDURA PHONE (ALL
 ZAKON O DENACIONALIZACIJI SLOVENIJE ZAKON O DENACIONALIZACIJI (URADNI LIST
 PART ONE GENERAL TABLE OF CONTENTS PART ONE –