readme for high resolution rainfall data derived from the mit radar 1. data set information these high resolution data sets were
README for High Resolution Rainfall Data Derived from the MIT Radar
1. DATA SET INFORMATION
These high resolution data sets were developed for use in freshwater flux
studies near the IMET buoy region of the IFA. These data sets were produced
by the Texas Tech University Atmospheric Science Group, using data collected
from the MIT radar onboard the R/V Vickers. Data from all three cruises of
the Vickers were processed, and gridded reflectivity and rainfall
accumulation fields were produced.
To produce fixed-space data fields, the ship motion was removed from the raw
data. This was done using the GPS data recorded by the ship's bridge. This
data was chosen over the navigation data used by the radar to avoid errors
resulting from Schuler Oscillations in the radar's INU.
Careful processing of the data in limited ranges from the radar allowed the
full radial resolution of the data to be used. The gridded data fields have
a spatial resolution of 0.25 km x 0.25 km and a temporal resolution of
approximately 10 minutes. It should be noted that the resolution of the
grid does not imply that each pixel is a unique data point. A single radar
bin will be distributed over several grid points. However, these
resolutions allow for detailed depiction of the spatial structure of
precipitation patterns, as the radial resolution of the data is retained.
The grid region covers a 100 km x 100 km region of the IFA centered at the
nominal Vickers ship position of 2 degrees, 5 minutes South latitude, and
156 degrees, 15 minutes East longitude. This grid region was chosen so that
as many of the ships and buoys clustered near 2 S, 156 E were included in
the analyses. Accounting for ship drift and the shape of the grid, the
maximum radial distance used in the analyses was 80 km.
Gridded reflectivity fields were produced for each of the raw radar files
processed. The raw gridded reflectivity data need to be corrected before
rainfall rates can be computed. For the MIT radar data, this involves
adding a flat 2.4 dBZ to all the reflectivity data. This correction is NOT
built into the gridded reflectivity data and must be applied by the user.
This is allows the user more control over the correction factor, which will
be useful if the correction factor is changed in the future.
These reflectivity fields were corrected and then converted to rainfall rate
using a partitioned stratiform/convective Z-R relationship developed by NASA
GSFC. This means that convective and stratiform elements were identified,
and a different Z-R was used to determine rainfall rate for each. The
convective Z-R is Z=139 R**1.43 and the stratiform Z-R is Z=374 R**1.43
(Tokay and Short, 1995). To accomplish this partitioning, the reflectivity
data were actually gridded in a 130 km x 130 km region, and the
stratiform/convective split was accomplished using the method described by
Steiner et al. (1995). Using the larger grid allows for precipitation
regions at the boundaries to be accurately accounted for. The grids were
integrated over approximately one hour periods to produce gridded fields of
accumulated rainfall in the 100 km x 100 km grid region.
2. DATA SOURCE INFORMATION
The raw SIGMET Interactive Radar Information System (IRIS) data collected by
the MIT radar were used to compile these data sets. Only the data from the
full volume scans were used. These scans were set up to collect data at a
radial resolution of 0.25 km, azimuthal resolution of 1 degree, and a
maximum range of 150 km. One full scan was collected every 10 minutes.
However, azimuthal resolution was actually collected at variable azimuthal
resolutions of either 1 or 2 degrees, with the resolution changing both from
scan to scan, and within a single scan.
Data from the lowest three elevation angles of the volume scan were
processed. The nominal values of these elevation angles are 0.8, 1.5, and
2.3 degrees. The data from lowest angle were used for ranges greater than
25 km, the data from the second angle were used at ranges of 15 to 25 km,
and the data from the third sweep were used at ranges within 15 km. This
helped to eliminate much of the sea clutter found in the data, as well as
reduce the effect of the ship blockage from the data.
During several periods in Cruise 3, the ship moved away from its nominal
position in the IFA to conduct dual Doppler scanning with the TOGA radar.
During these periods, the radar was beyond the range limit for accurate
gridding. Reflectivity grids were produced for these time periods, but no
accumulated rainfall data were produced. This will allow researchers who
are qualitatively interested in what was going on in the grid region to
examine the reflectivity fields for those times.
3. DATA SET ORGANIZATION
There are three types of data files, with each data type partitoned by cruise
number.
I. Gridded reflectivity data
These files are named with the following convention: "rf_DAY_TIME.dat.Z",
where DAY refers to the Julian day the data was collected, and TIME refers
to the start time of the processed radar scan in UTC. These files are in
compressed UNIX format and need to be uncompressed before being processed
('uncompress filename').
The first line of the data file contains the time of the scan in decimal
form (e.g. a scan time of 1022 UTC would be stored as 10.36667), the
latitude of the ship at scan time, and the longitude of the ship at scan
time. The remaining lines of the file are the reflectivity data. These
data are stored in a coded format to reduce the size of the files. The data
are stored a column at a time, working south to north, and from west to
east. The data should be read using the sample code provided in Section 4.
The extracted reflectivity data are in units of dBZ, and are recorded at 0.5
dBZ increments (same as the raw radar data).
II. Gridded accumulated rainfall data
The gridded accumulated rainfall files are named with the following
convention: "rtot_DAY_TIME_+DURATION.out.Z", where DAY refers to the Julian
day the data were collected, TIME refers to the start time in UTC of the
time period being processed, and DURATION refers to the length of time
accounted for in the accumulation. These files are in compressed UNIX
format and need to be uncompressed before being processed ('uncompress
filename').
For example, the file rtot_344_2100_+0101.out.Z contains the rainfall
accumulated over the one hour and one minute (61 minute) period beginning at
2100 UTC on Julian day 344. In most cases the DURATION of the accumulations
is 58-62 minutes, and therefore these fields can be considered as hourly
accumulated rainfall totals. However, this is not true in all cases, as
accumulations were also computed for periods with limited missing data.
Accumulations are presented for all hours that contained 38 minutes or more
of reflectivity data.
The first line of the data file contains the amount of time (in hours) of
the duration of the accumulation. An accumulation that covers 58 minutes,
for example, would be stored as 0.966667 hours. The remaining lines of data
are rainfall accumulations in mm. The data are stored a column at a time,
working south to north, and from west to east. Sample code is provided
below to access these files. Note, these data can be converted to fields of
hourly rainfall rate simply by dividing the accumulation at each grid point
by the time of duration, changing the units to mm/hr.
III. Gridded accumulation images
The accumulation fields described above have been presented graphically in
the form of GIF images. These images show the gridded accumulation field,
and present some basic statistics of the data field, such as mean and
maximum rainfall accumulations. These images can be directly accessed using
many standard image viewers.
IV. MORE INFORMATION
For a complete reference list and for more information on the processing of
the raw radar data, the production of the gridded accumulation fields, and
some examples of how this data might be used refer to:
Doggett, Arthur L.,IV, 1996: Analysis of rainwater flux in the IFA during TOGA
COARE using shipboard radar rainfall estimates. Doctoral Dissertation,
Texas
Tech University, 174 pp.
or contact Colleen Leary at Texas Tech University:
e-mail: [email protected]
phone: (806)742-3417
fax: (806)742-0100
APPENDIX A: SAMPLE READ PROGRAMS
I. The following C code can be used to used to read an uncompressed
reflectivity data file and store the data in an array named 'reflectivity'.
Note that the grid region is 130 km x 130 km.
-----------------------------------------------------------------------
#include
FILE *infile;
DEFINE ROWS 522
DEFINE COLUMNS 522
main()
{
float reflectivity[ROWS][COLUMNS];
int i,j; unsigned char ch;
float dbz, dbz_corr, lat, lon, time;
char fname[100];
dbz_corr=2.4; /* Standard MIT reflectivity adjustment derived by NASA */
/* You can apply a different correction here if needed */
/* Get data file name and open file */
printf("File name? ");
scanf("%s",fname);
if(fopen=infile(fname,"r"))==NULL)
{
printf("File not found\n");
exit(-1);
}
/* Read header line data */
fscanf(infile,"%f %f %f\n",&time,&lat,&lon);
/* Echo file information to screen */
if(echo_flag==1)
printf("Time: %5.3f, Lat: %5.2f, Lon: %5.2f\n",time,lat,lon);
/* Process stream of coded reflectivity values in dBZ */
for(i=0;i
fscanf(infile,"%c",&ch);
dbz=(float)ch;
/* Uncode data. Note raw reflectivty saved in 0.5 dBZ increments */
if(dbz<160.9)
dbz=(dbz-97.0)/2.0;
else
dbz=(dbz-131.0)/2.0;
/* Apply NASA correction to reflectivity */
dbz+=dbz_corr;
/* Put data in grid */
reflectivity[j][i][0]=dbz;
}
/* DATA READY TO PROCESS */
/* reflectivity[0][0] is southwest corner of grid */
/* reflectivity[0][521] is southeast corner of grid */
/* reflectivity[521][0] is northwest corner of grid */
/* reflectivity[521][521] is northeast corner of grid */
/* Center of grid is reflectivity[260][260] */
}
--------------------------------------------------------------------------
II. The following C code reads the uncompressed rainfall accumulation data
files. This code reads the accumulated rainfall into the array 'accumulation'.
-------------------------------------------------------------------------------
#include
FILE *infile;
DEFINE ROWS 401
DEFINE COLUMNS 401
main()
{
float accumulation[ROWS][COLUMNS];
int i,j; unsigned char ch;
float accum, time;
char fname[100];
/* Get data file name and open file */
printf("File name? ");
scanf("%s",fname);
if(fopen=infile(fname,"r"))==NULL)
{
printf("File not found\n");
exit(-1);
}
/* Read header line data */
fscanf(infile,"%f\n",&time);
/* Process stream of coded reflectivity values in dBZ */
for(i=0;i
fscanf(infile,"%f",&accum);
accumulation[j][i]=accum;
}
/* DATA READY TO PROCESS */
/* accumulation[0][0] is southwest corner of grid */
/* accumulation[0][400] is southeast corner of grid */
/* accumulation[400][0] is northwest corner of grid */
/* accumulation[400][400] is northeast corner of grid */
/* Center of grid is accumulation[200][200] */
}
--------------------------------------------------------------------------
 RECTANGLE 222 CATRE ASOCIATIA ROMANA DE EXAMINARI NEDISTRUCTIVE CERERE
 IL PARTENONE IL PARTENONE PROPORZIONE COME ESPRESSIONE DELLA RELAZIONE
 VLOGA ZA PRIDOBITEV SPLETNEGA KVALIFICIRANEGA DIGITALNEGA POTRDILA I PODATKI
 DIRECTORIO DE SERVICIOS MÉDICOS HOSPITAL REGIONAL DE YAHUALICA UBICACIÓN
 KRAKÓW DN 01042020 R ZAWIADOMIENIE O WYNIKACH W ZAKRESIE
 COMPARATIVE EMERGENCY MANAGEMENT SESSION NO 25 COURSE TITLE COMPARATIVE
 INSTITUCIÓN EDUCATIVA HUMBERTO TAFUR CHARRY NEIVA ÁREA CIENCIAS NATURALES
 PLIEGO DE PRESCRIPCIONES TÉCNICAS PARA LA ADQUISICIÓN DE INFRAESTRUCTURA
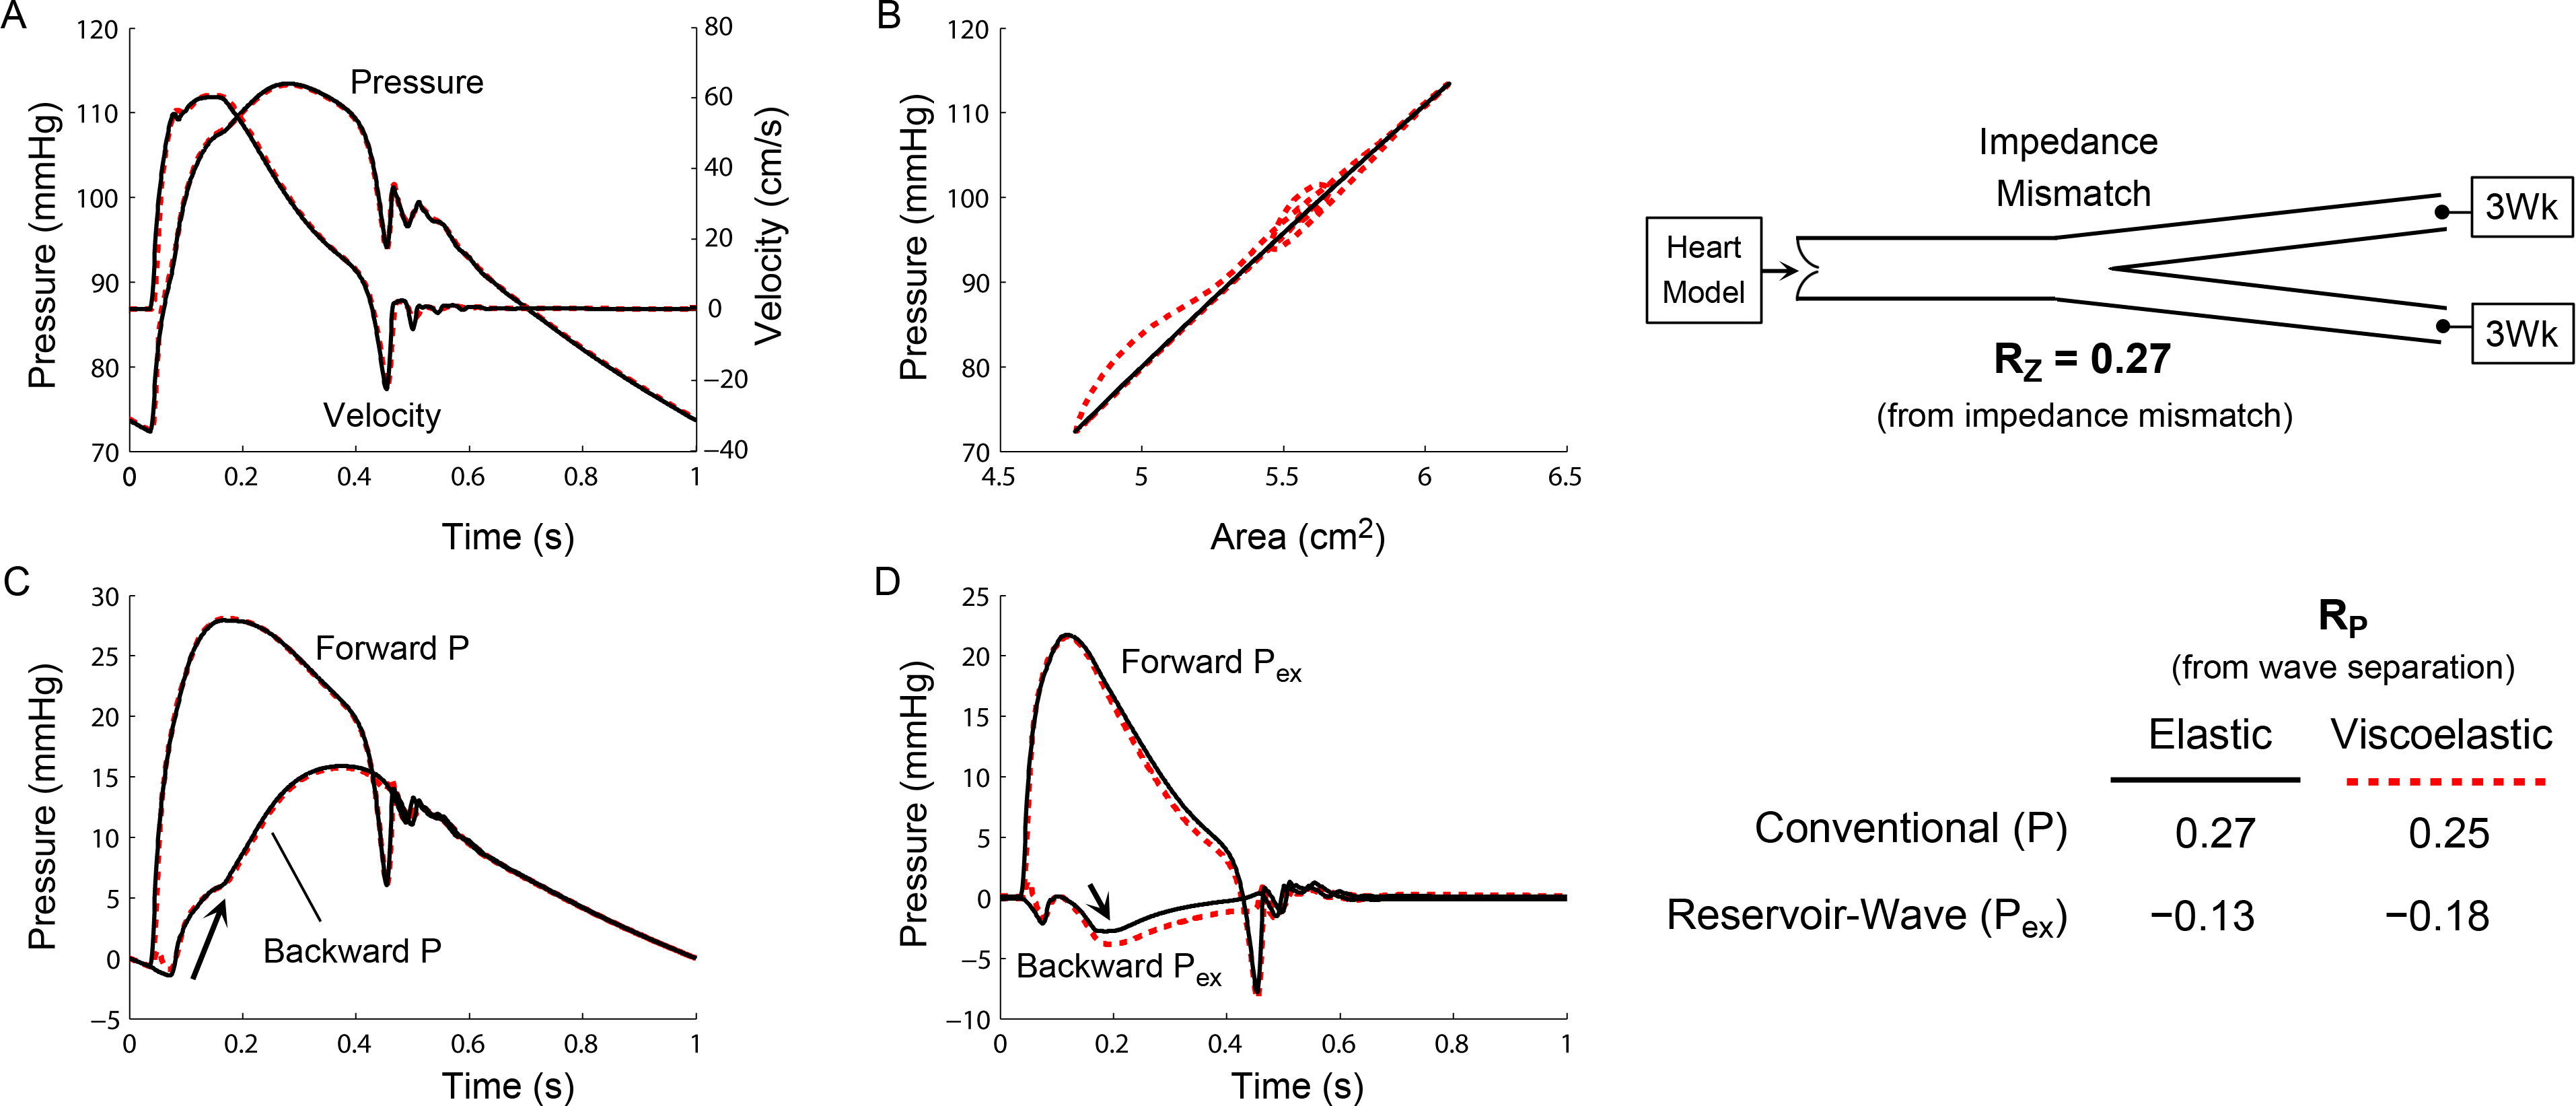
 THE CASE AGAINST THE RESERVOIRWAVE APPROACH WE READ WITH
 ΈΚΘΕΣΗ 2017 ΓΡΑΦΕΊΟΥ ΟΙΚΟΝΟΜΙΚΏΝ ΚΑΙ ΕΜΠΟΡΙΚΏΝ ΥΠΟΘΈΣΕΩΝ MΟΣΧΑΣ ΓΙΑ
 EECS 322 TEST 5 SAMPLE MONDAY MAY 1
 FORMULARIO DE SOLICITUD PACIENTES EXPERTOS – INVESTIGADORES SUMMER SCHOOL